Guides
Business and economic reporting: a guide to numbers and claims: the 2027 view
Business and economic reporting guide covering releases, company filings, indicators, revisions, market reactions, household effects, and clear comparisons.
What to take away
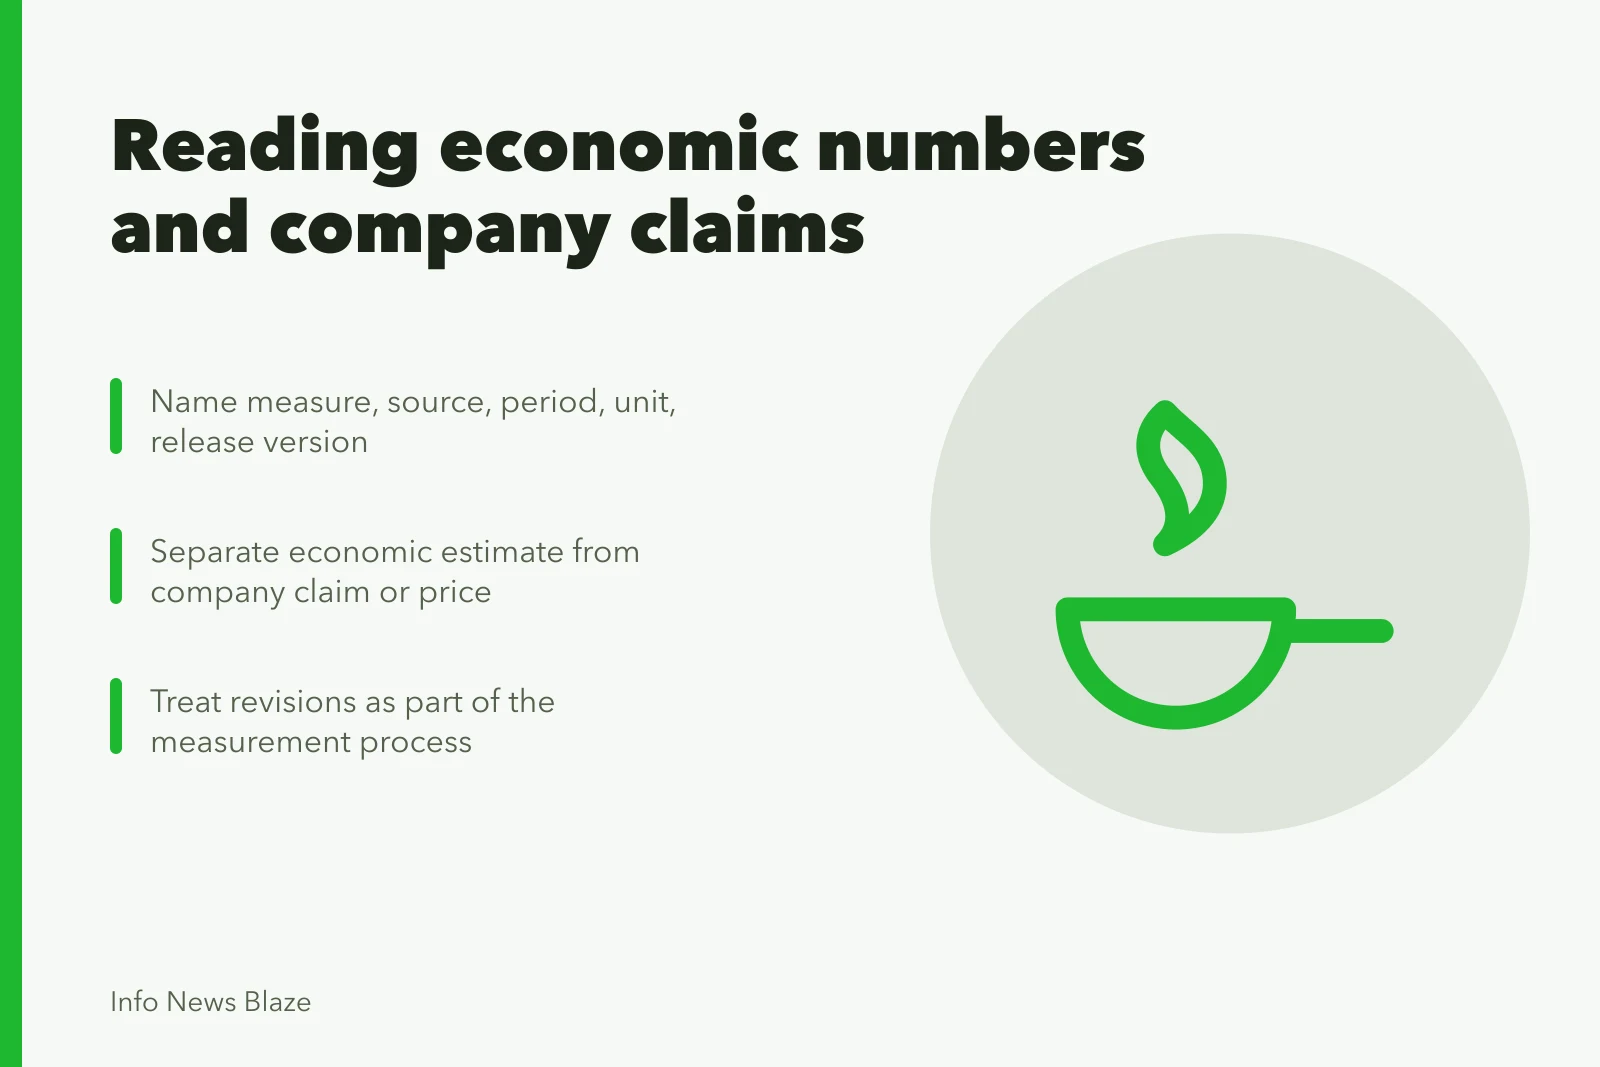
- Name the measure, source, period, unit, and release version.
- Separate an economic estimate from a company's claim or a market price.
- Compare like periods and explain seasonal or inflation adjustments.
- Treat revisions as part of the measurement process.
- Connect national figures to households without inventing a universal experience.
Economic news compresses large systems into a few familiar numbers. Gross domestic product, inflation, payrolls, retail sales, profit, and share price answer different questions. A useful briefing identifies the question each number can answer before describing whether it rose or fell.
Photo and credit
The image illustrates a trading room. It does not show a specific exchange event, price move, company, or economic release discussed here.
Build a number card
Use one card for every figure that could enter the headline.
Number card fields
- Measurewhat is counted or estimated
- Produceragency, company, exchange, researcher
- Periodmonth, quarter, fiscal year, point in time
- Unitdollars, index points, people, jobs, rate
- Adjustmentnominal, real, seasonal, per-capita, currency
- Versionadvance, preliminary, revised, audited, final
- Comparisonprevious period, year ago, forecast, baseline
Field / Reporting question
- Measure
- What exactly is counted or estimated?
- Producer
- Which agency, company, exchange, or researcher produced it?
- Period
- Month, quarter, fiscal year, or point in time?
- Unit
- Dollars, index points, people, jobs, rate, or percentage change?
- Adjustment
- Nominal, real, seasonal, per-capita, or currency adjusted?
- Version
- Advance, preliminary, revised, audited, or final?
- Comparison
- Previous period, same period a year ago, forecast, or baseline?
- Scope
- National, regional, industry, company, or selected sample?
A number without this card can be mathematically accurate and still mislead. The card generalizes the method in reporting statistics and polls.
Start with the institution and document
Find the official release, tables, technical note, schedule, and revision policy. For a company, retrieve the regulatory filing and financial statements. For a market move, identify the venue, instrument, trading session, and time stamp.
Do not rely on a screenshot or a quoted figure when the underlying table is available. Preserve a copy of the version used because official data and corporate filings can be amended.
For United States public companies, the filings sit in one system. Investor.gov's guide to researching filings in EDGAR says the database gives free public access to a company's financial information and operations through its SEC filings, and that a form type ending in /A marks an amendment. The guide covers SEC-registered filers, not private firms.
Compare the right periods
A month-to-month change answers a different question from a year-over-year change. A quarterly figure reported at an annual rate is not the same as growth during a full year. Fiscal quarters may not match calendar quarters. The time and comparison section of the statistical claim checklist makes matching period length and seasonal treatment an explicit test.
Choose the comparison that fits the claim, then state it. If a release provides several comparisons, explain why the article emphasizes one and show another when it changes the interpretation.
Distinguish real and nominal figures
Nominal values use prices from the period being measured. Real values adjust for price change so output across periods can be compared. Per-capita measures divide by a population estimate. Each transformation answers a narrower question and brings another source or method into the result.
The Bureau of Economic Analysis page explaining what GDP measures and how releases work says the agency publishes an advance, second, and third estimate for a quarter as more source data arrive. It notes real GDP removes inflation effects and quarterly changes are generally reported at annual rates.
Those details belong near any GDP comparison that could otherwise be read as a raw quarterly change.
Treat estimates as estimates
Survey results, modeled values, and early releases carry sampling and nonsampling limits. Ask whether the producer publishes confidence intervals, response rates, historical revisions, benchmark changes, or sensitivity tests.
Revision does not automatically signal an error. It may reflect later survey responses, more complete administrative records, seasonal-factor updates, a corrected classification, or a changed method. Report why the figure changed when the source explains it. The seasonal data desk case walks one revision from release to corrected headline.
Read company language against the statements
Management may emphasize adjusted earnings, organic growth, bookings, or another preferred measure. Locate the definition and reconciliation. Compare that measure with the closest standardized figure and with prior periods calculated on the same basis.
Separate revenue, profit, cash flow, debt, and market value. A company can report revenue growth and a net loss at the same time. A rising share price records trading, not a direct vote on every part of the filing.
Connect the macro figure carefully
National averages do not describe every household, worker, region, or business. Use component data and reporting from affected groups to explain distribution. Avoid turning one interview into proof of a national pattern.
A stronger paragraph moves in order: national measure, component responsible for the move, documented local or household mechanism, and a limit on how broadly that example applies. The structure is the layered briefing from developing news stories applied to economics.
Common questions
Is a market reaction proof that an announcement was good or bad?
No. Prices can reflect prior expectations, simultaneous news, positioning, liquidity, and changing assumptions. State the move and time without assigning a motive that traders did not confirm.
Should revised data replace the original number in an article?
Update the current figure and preserve a note when the revision changes the story's meaning. Historical coverage may still need the number known at that time.
Does GDP measure household well-being?
GDP measures production. It does not by itself describe distribution, unpaid work, health, security, or every part of household welfare.
What makes a business comparison fair?
Use the same definition, accounting period, currency treatment, business scope, and adjustment method on both sides.