Guides
Part of Business and economic reporting: a guide to numbers and claims: the 2027 view
How to read an economic release before publishing a headline as of 2027
How to read an economic release by checking definitions, periods, adjustments, components, revisions, uncertainty, technical notes, and comparable series.
What to take away
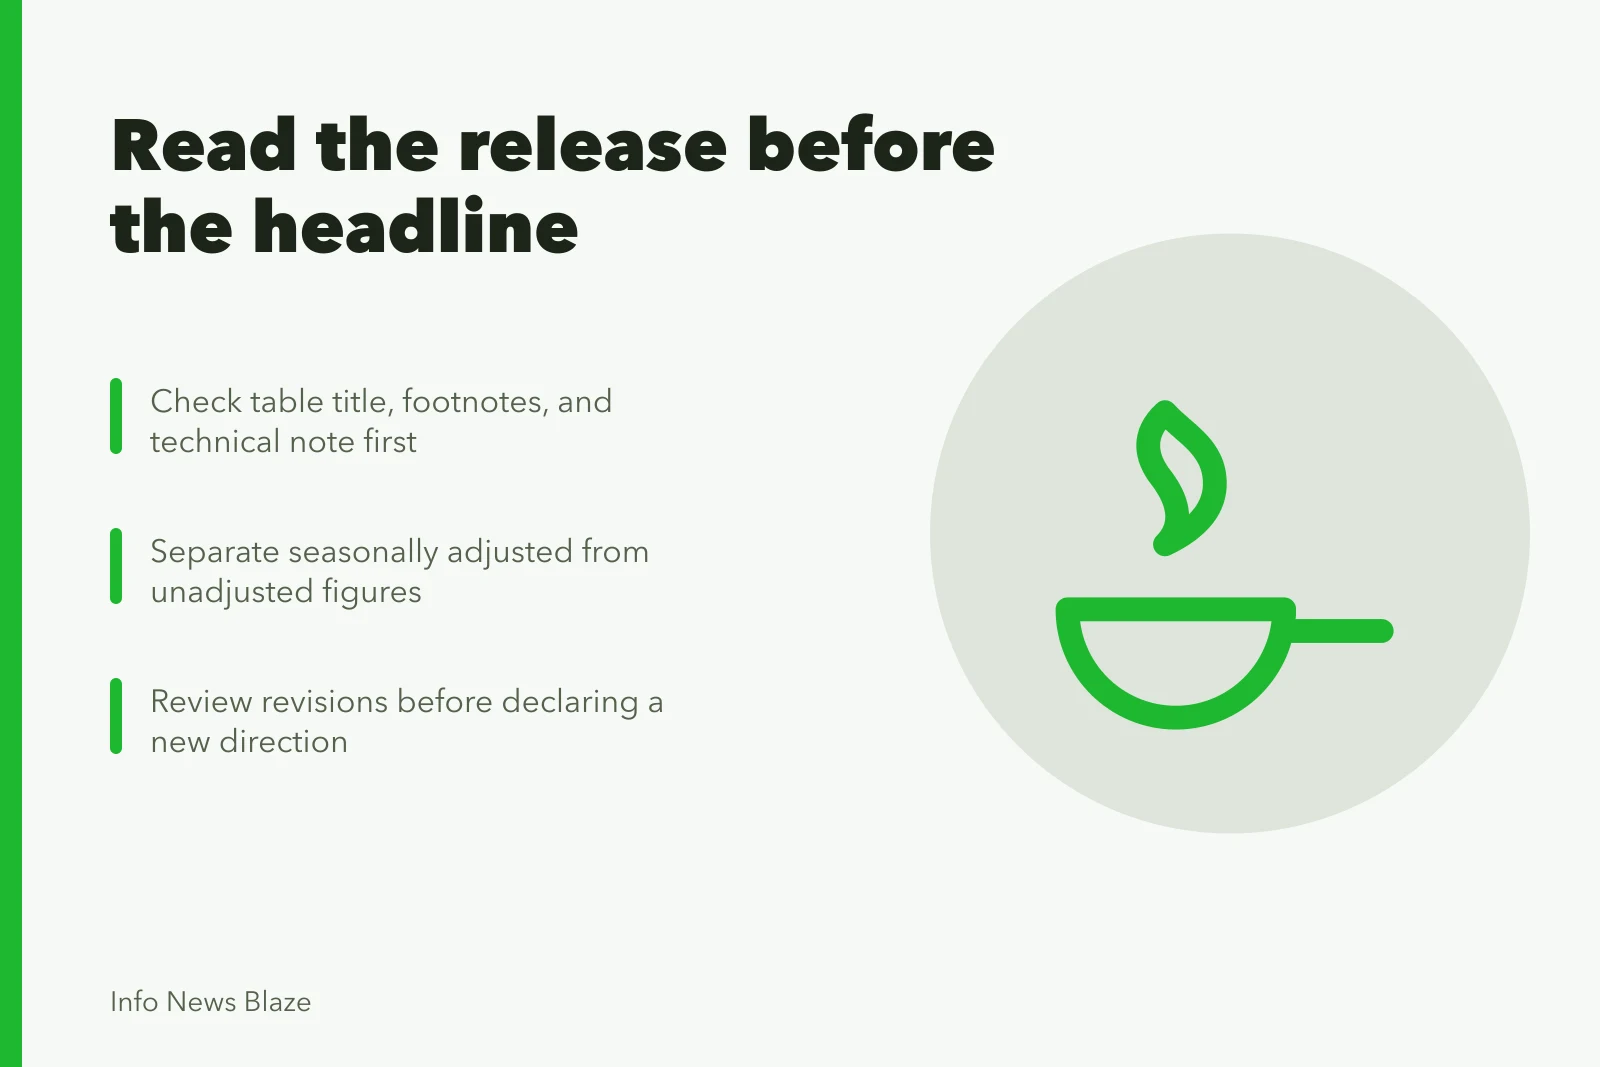
- Read the table title, footnotes, and technical note before drafting.
- Identify the period and comparison behind every change.
- Keep seasonally adjusted and unadjusted figures separate.
- Check revisions to earlier periods before declaring a new direction.
- Explain which components moved the total.
An economic release is a package, not a single number. The headline table, detailed tables, definitions, seasonal notes, revision history, and release calendar work together. Reading only the first paragraph can hide the distinction that changes the story. The wider context sits in the business and economic reporting guide.
Photo and credit
The scene is illustrative. It does not show the U.S. sample used for any price or retail-sales release.
Step 1: identify the release
Release identification checklist
- Agency and program
- Release title
- Publication date and time
- Reference period
- Release number
- Next scheduled publication
- Saved HTML or PDF
Release calendars are published well ahead. The Bureau of Economic Analysis news release schedule lists each upcoming release with its date, time, and covered period, which lets a desk plan coverage in advance. Other statistical agencies keep their own calendars.
Check for a correction notice. A current page can change after the first publication, so a saved copy lets the desk show what it reviewed.
Step 2: define the measure
Write the measure without its acronym. Ask what is included, excluded, estimated, imputed, or classified elsewhere. Identify whether the value is a level, index, rate, share, or change.
Define the measure
What is the value type?
Level or index -> record reference base
Rate -> identify numerator, denominator, population
For an index, record the reference base and do not describe index points as a percentage. For a rate, identify the numerator, denominator, and eligible population. Percent-versus-points slips of the same family are a standing entry in statistics reporting problems.
Step 3: label the period and comparison
Translate the table heading into a sentence:
Period and comparison
Month-to-month
- Adjustment
- Seasonally adjusted
- Comparison
- Prior month
- Sentence
- Changed X percent
- Warning
- Do not blend
Year-over-year
- Adjustment
- Unadjusted
- Comparison
- Same month last year
- Sentence
- Changed Y percent
- Warning
- Do not blend
The seasonally adjusted index changed by X percent from [month] to [month].
or
The unadjusted index changed by Y percent from [month last year] to [month this year].
Do not blend the month-to-month value with the year-over-year explanation. A short monthly move can occur inside a different annual trend.
Step 4: check adjustment status
Seasonal adjustment estimates recurring calendar patterns and removes their expected effect from a series. Unadjusted figures retain those movements. The two versions serve different comparisons and should not be placed on opposite sides of one calculation.
The Bureau of Labor Statistics page on using the CPI for escalation says seasonal factors update annually, and seasonally adjusted CPI data can be revised for up to five years after original release.
Adjusted data are inappropriate for escalation agreements. That guidance is specific to CPI; do not copy it to every economic series without checking its own method.
Step 5: reconcile the total and components
Find which categories contributed to the change. A large percentage move in a small component may have less effect on the total than a modest move in a heavily weighted category.
Do not add published percentage changes unless the method says that is valid. Index aggregation often uses weights and formulas that make a simple sum wrong.
Step 6: inspect revisions
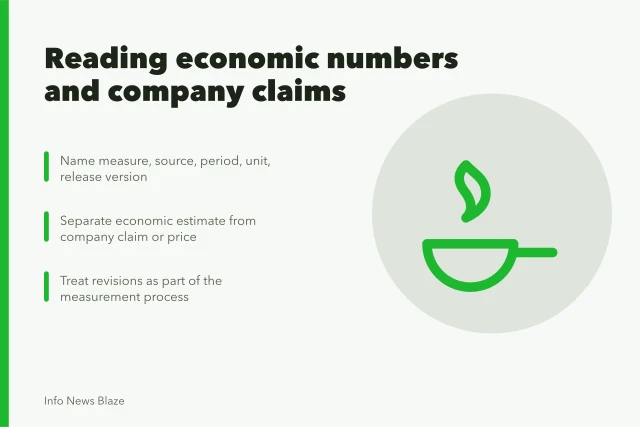
Copy the current and prior published values for the periods under discussion. Then calculate how the revision changes the level, monthly change, and apparent trend.
A revised earlier month can make the newest change look larger or smaller even when the latest estimate stays the same. Write the sequence from the currently published data and note a material revision. The seasonal data desk case shows a desk doing exactly this recalculation.
Step 7: read the technical note
Look for sample design, response rate, collection dates, imputation, seasonal method, confidence interval, annual benchmark, and known disruption. A holiday, disaster, funding lapse, strike, or classification change may alter collection or interpretation.
The technical note should shape the article, not sit in a late caveat. Put the most consequential limit beside the number it qualifies.
Step 8: compare with another series cautiously
Two indicators may cover different populations, sectors, time frames, and accounting rules. Explain why they can move differently. Do not call one "wrong" because it does not match another measure built for a different purpose. The four comparison dimensions in reporting statistics and polls formalize that check.
Release reading worksheet
Check / Desk note
- Measure and unit
- Reference period
- Comparison period
- Adjustment status
- Release version
- Major components
- Prior revisions
- Stated uncertainty
- Next release
Common questions
Is the first estimate the least reliable?
It uses the information available first and may change as more data arrive. Its usefulness depends on the program and the size and pattern of later revisions.
Can seasonally adjusted data be compared with last year?
Sometimes, but use the comparison the producer supports and keep the adjustment basis consistent. Many releases present unadjusted annual changes directly.
What if components and the total seem inconsistent?
Check weights, rounding, aggregation formulas, and whether values are contributions or separate growth rates.
Should a forecast appear in the lead?
Only when the comparison is relevant and the forecast source, date, range, and method are clear. The official estimate remains distinct from expectations.