Reviews
Part of Business and economic reporting: a guide to numbers and claims: the 2027 view
Economic indicators compared, from jobs numbers to market prices
Economic indicators compared across output, income, prices, jobs, unemployment, wages, retail sales, and markets, with reporting uses and limits.
What to take away
- No single indicator describes the whole economy.
- Output, income, prices, employment, and spending use different units and sources.
- Release timing and revisions affect comparisons.
- A national average can conceal distribution and sector differences.
- Market prices record transactions and expectations, not household conditions directly.
Economic indicators overlap, but they are not substitutes. The reporting question should select the measure. "Did production grow?" needs a different source from "Did typical hourly pay keep pace with prices?" Release mechanics for any of them are covered in reading an economic release.
Indicator comparison
Indicators and Their Limits
Indicator
- GDP
- Final output
- GDI
- Income from production
- CPI
- Price change
- Payroll employment
- Jobs on payrolls
- Unemployment rate
- Unemployed share
- Average hourly earnings
- Average pay change
Main question
- GDP
- Hides distribution
- GDI
- Can diverge from GDP
- CPI
- Baskets vary
- Payroll employment
- Jobs not people
- Unemployment rate
- Definition dependent
- Average hourly earnings
- Composition moves average
Reporting limit
- GDP
- GDI
- CPI
- Payroll employment
- Unemployment rate
- Average hourly earnings
| Indicator | Main question | Common unit | Reporting limit |
|---|---|---|---|
| GDP | What final output was produced? | Real or current dollars; growth rate | Broad total does not show distribution |
| GDI | What income arose from production? | Real or current dollars; growth rate | Different source data can diverge from GDP |
| CPI | How did prices change for an urban-consumer basket? | Index and percentage change | Not every household buys the same basket |
| Payroll employment | How many jobs are on covered nonfarm payrolls? | Jobs and monthly change | Jobs are not unique people |
| Unemployment rate | What share of the labor force is unemployed? | Percentage | Depends on labor-force status definitions |
| Average hourly earnings | How did average pay among covered workers change? | Dollars and percentage change | Workforce composition can move the average |
| Retail sales | How did sales at covered retailers and food services change? | Dollars and percentage change | Sales are not the same as real consumption volume |
| Stock index | How did prices of selected securities move? | Index points and percentage change | Does not directly measure production or welfare |
Output and income
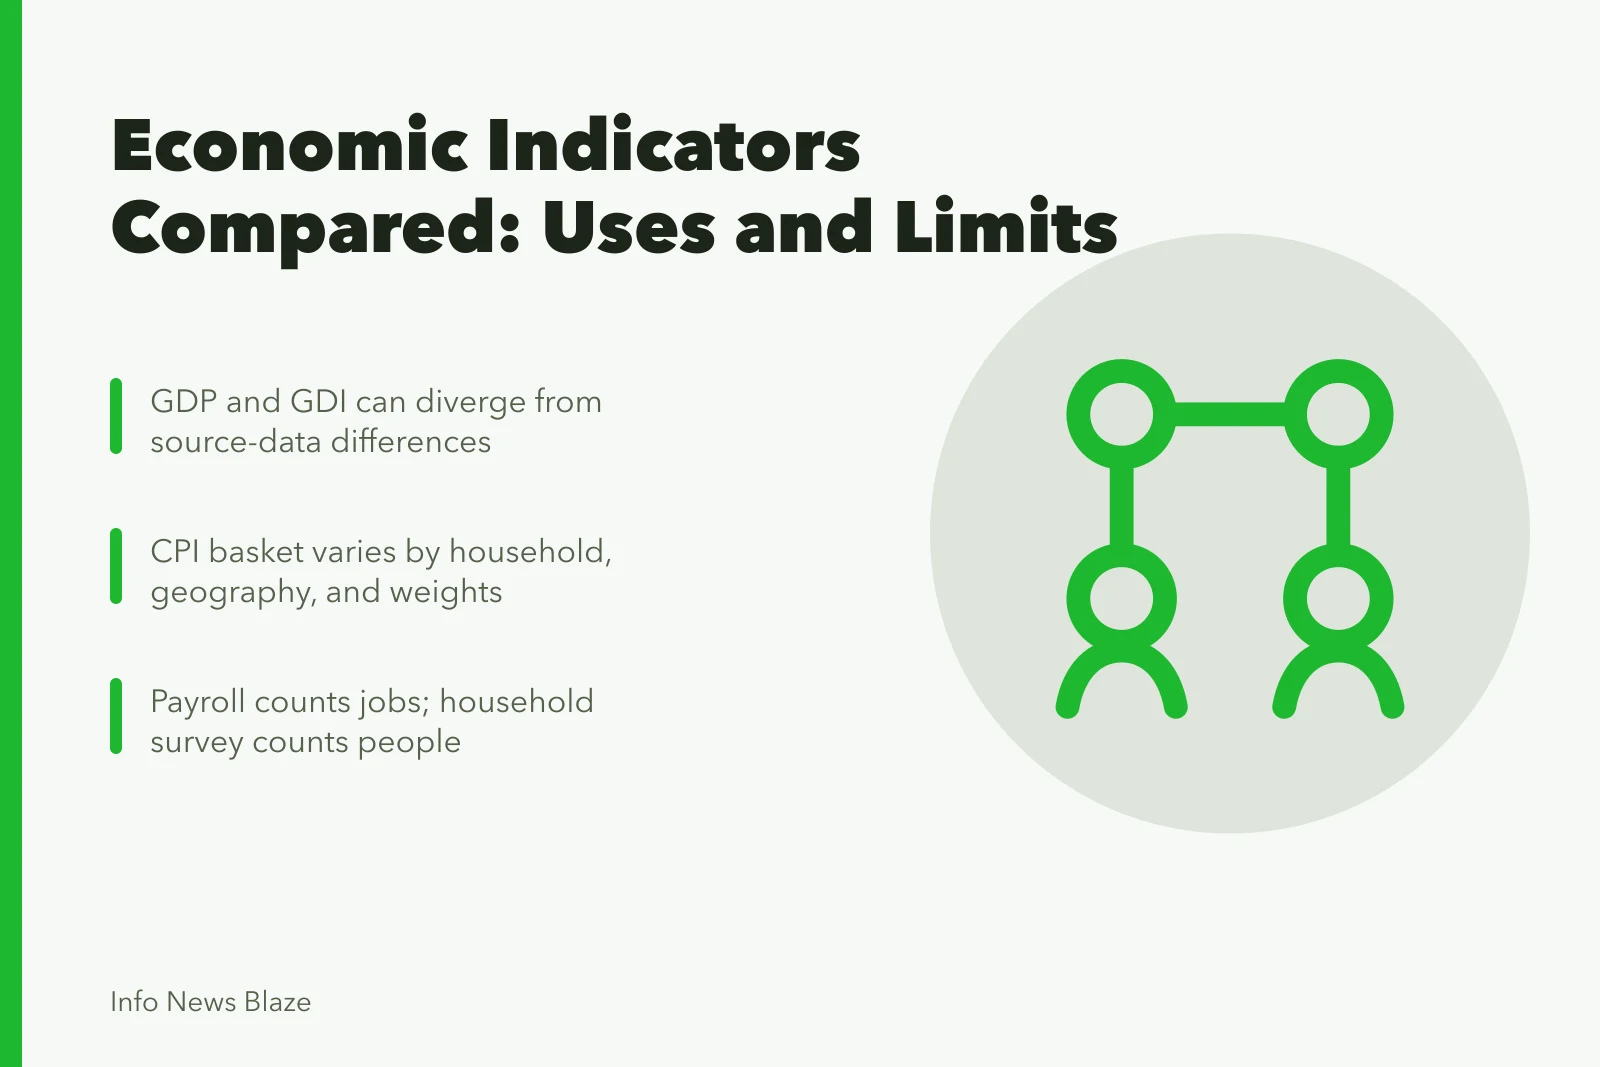
GDP estimates the value of final goods and services produced. GDI measures the incomes earned and costs incurred in producing that output. In theory, the two should be equal. In published data they can differ because they use different source material and estimation paths.
The BEA page on gross domestic income and its relation to GDP explains that source-data differences produce a statistical discrepancy and that the agency also publishes an average of real GDP and real GDI. A divergence is therefore a measurement question to report, not proof that only one side is genuine.
Use real values for changes in output across time when price effects would distort the comparison. Use current-dollar figures when the nominal amount itself is the subject, such as the dollars spent or received. The business and economic reporting guide keeps those two questions separated by default.
Prices and purchasing power
A consumer price index measures change in a defined basket for a defined population. It does not mean every price rose by the headline rate. Component indexes, weights, geography, and household purchases vary.
To discuss purchasing power, compare an income measure with a suitable price measure on consistent periods. A wage increase above one broad inflation rate does not show that every worker gained, since hours, taxes, job changes, and personal spending differ. An average that hides the mix is the summary-statistic trap in statistics reporting problems.
Jobs and people
Payroll employment counts jobs in covered establishments. A person with two jobs can appear twice. A household survey can count employed people and classify unemployment, but it has another sample and definitions. A seasonal data desk case shows how a newsroom separates raw and adjusted jobs figures when the headline shifts.
Do not explain a difference between the two series as an error without examining scope and uncertainty. Choose the series tied to the claim and state what it counts.
Spending and sales
Retail-sales estimates track sales at covered businesses. They can rise because more units were sold, prices increased, or the mix changed. The total does not cover every type of consumer spending.
The Census Bureau's description of the Monthly Retail Trade Survey distinguishes advance and later estimates and notes that the monthly retail series receives an annual revision. This supports labeling release versions and checking revisions before comparing a new month with old coverage.
Business results and market prices
Company revenue records sales under accounting rules. Profit reflects revenue and expenses. Cash flow follows cash movement. A share price is the transaction price for an ownership claim. These figures can move in different directions without contradiction.
When a share price moves after a release, report the time, scale, and broader market context. Attribute a reason only when traders, analysts, or documented order information support it. Restrained sequence language comes from the news timeline method: "after" is not "because."
Select the measure by question
Choose Measure by Question
What is the question?
Production -> real GDP and industry contributions
Income from production -> GDI and components
Common questions
Can GDP rise while many households struggle?
Yes. GDP measures aggregate production, not how income or gains are distributed among households.
Are jobs and employed people the same count?
No. Payroll data count jobs, while household measures count people under their survey definitions.
Does higher retail sales mean people bought more goods?
Not necessarily. Higher prices and a different sales mix can raise nominal sales.
Which indicator should lead a monthly economy story?
The one that answers the stated question. A broad briefing may need several indicators with their different periods and limits made explicit.