Guides
5 details of feature updates statistics people miss
Five overlooked details explain why feature update statistics mislead, from missing change registers to staged rollouts and self-selected surveys.
What to take away
Feature updates statistics get quoted in decks every quarter. Five details decide whether the number in that deck means anything. Most people never check those details.
That is why the same broken figures keep circulating. Public examples show what to check: Google Play, Apple App Store Connect, Microsoft Windows Update, Mozilla Firefox, and AAPOR. The first four publish product records, and AAPOR publishes survey standards.
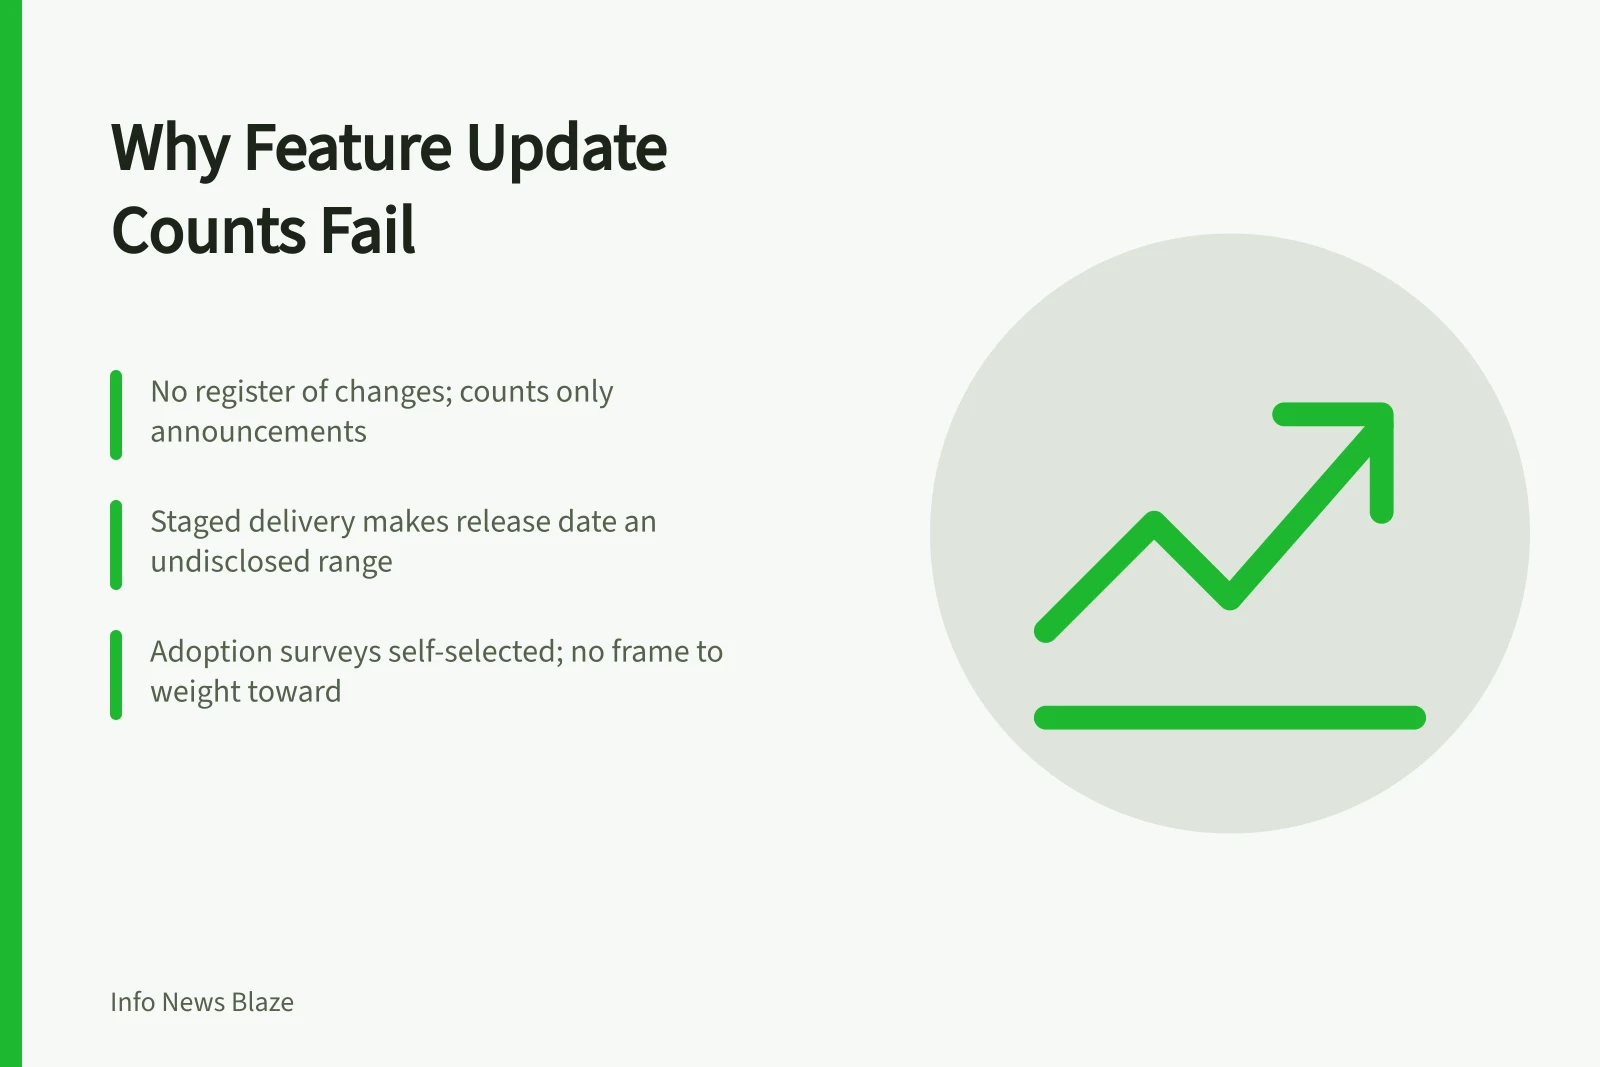
- No public register lists every product change, so any count you see counts announcements, not changes.
- Staged delivery gives a change several defensible ship dates. Only the operator can pick between them.
- Adoption surveys recruit people who already care about the change. That is selection bias at the recruitment stage.
- A response rate tells you how much room non-respondents have to differ from respondents. Ask for it first.
- If a figure has no stated population, period, or denominator source, treat it as decoration.
Detail 1: no public change register counts every change
A register would list every change: the ones nobody announced, the ones rolled back before anyone noticed, the ones that touched a fraction of accounts. Nobody publishes one. A change register kept by the operator would be the only complete version, and operators treat announcement as a product decision, not a counting decision.
So a count of changes is a count of announcements. Two operators with identical change rates and different documentation habits produce wildly different totals.
Google Play release notes, Apple App Store version history, Microsoft's Windows release health dashboard, Mozilla's Firefox release notes, and Atlassian's public changelog each list announced changes. None promises every internal fix, rollback, or partial rollout.
Detail 2: staged delivery breaks the release date
A change reaches a slice, gets watched, then reaches a bigger slice, and occasionally goes back. 'Released' becomes a range, and the range is undisclosed.
Ask when it shipped and several answers hold up. Google Play lets developers send a build to 5%, then 10%, 20%, 50%, and 100% of users. Apple's phased release spreads automatic updates over 7 days.
Microsoft Windows 11 offers a 10-day rollback window and lets administrators pause updates for up to 35 days. Mozilla ships Firefox on a 4-week cadence. Each practice turns 'released' into a range.
Only the operator can settle which date is right. Its own documentation is the only source with standing.
This matters because almost every wanted figure is a rate: changes per quarter, share of accounts reached, days to adoption. A rate needs a population and a period, and staged delivery weakens both at once.
The concept being violated is operationalization. Before you count something, define it so two people would apply it identically. From outside, 'released' cannot be defined that way.
Staged rollout softens the rate
- Change reaches a slice
- Slice gets watched
- Bigger slice reached
- Occasionally rolled back
- Date becomes a range
- Denominator and period both soft
Detail 3: the sample selects itself
Surveys can be good. This one fails for a specific reason: the sample is not drawn. Anyone reporting adoption is surveying people who are reachable, interested, and willing. That group is defined by the outcome you are trying to measure, which is selection bias at the recruitment stage.
Weighting does not fix it. There is no frame to weight toward. Pew Research Center's American Trends Panel draws a sample and publishes its methodology, which is the contrast that matters here.
Detail 4: the response rate goes missing
A response rate tells you how much room non-respondents have to differ from respondents. In this field the room is usually enormous. The rate is unreported, or reported and small.
Finding that one number early is most of reading a whole report in twenty minutes. Question wording finishes the job. Asking whether someone has 'adopted' a change invites a yes from anyone who has seen it.
AAPOR's account of what a defensible survey has to disclose lists the items missing from nearly every figure in circulation here. AAPOR's standard definitions include several response-rate formulas, from RR1 through RR5.
Detail 5: the denominator is invented
Every adoption rate is a ratio, and the bottom term is the one nobody has. The population of accounts that could have received the change is known only to the operator. So the rate is a ratio with one made-up term. It looks precise because the top term is real.
Google Play's staged rollout percentages are public, but the number of eligible devices is not. Apple's App Store Connect reports installs and sessions, not the share of all users who could update. Microsoft's Windows release health dashboard tracks known issues, not a comparable adoption rate. That leaves the denominator to the operator.
| Wanted figure | Where it breaks | What that does |
|---|---|---|
| Count of changes | No complete register exists | Counts announcements instead |
| Release date | Delivery is staged and partial | Date becomes an undisclosed range |
| Adoption rate | Denominator unknown from outside | Ratio with one invented term |
| Satisfaction figure | Respondents chose to respond | Measures who cared enough to answer |
| Response rate | Unreported or small | Hides how far non-respondents may differ |
Four failures and their effects
Wanted
- Change count
- No register
- Release date
- Staged delivery
- Adoption rate
- Unknown denominator
- Satisfaction
- Self-selected
Breaks
- Change count
- Counts announcements
- Release date
- Undisclosed range
- Adoption rate
- One made-up term
- Satisfaction
- Measures who answered
Result
- Change count
- Release date
- Adoption rate
- Satisfaction
What you can answer instead
Three questions survive contact with reality.
What changed for me, and when did I see it? Observable on your own property, no population needed, and it feeds every decision you actually face.
What did the operator publish, and on what date? Also observable, and the only citable statement about the product.
Did the change move anything of mine? Answerable by a comparison you build, not a figure you look up. The design that makes such a comparison readable is in how to build a fair test.
The rule this leaves you with
If a figure about product changes has no stated population, no stated period, and no stated source of the denominator, it is decoration. Almost nothing clears that bar. When something does, read the rest of the document. Check whether it treats its own figures that carefully.
Common questions
Are the vendors hiding these numbers?
Mostly they are not computing them either, at least not in any publishable form. Internally an operator tracks its own metrics against its own definitions. Those definitions are not comparable to anyone else's and are not meant to be. Google, Apple, and Microsoft publish rollout mechanics, not a shared adoption rate.
What about counting entries in a public changelog?
You can count them, and the count is real, but it measures editorial practice. Say what you counted and the number becomes honest and much less interesting. Google Play release notes, Apple App Store version history, and Mozilla Firefox release notes are editorial products, not change registers.
Could a bigger panel fix the sampling problem?
Size is the wrong lever. A panel recruited the same way stays wrong at any size, and a bigger sample only narrows the interval around a biased estimate.
What would fix it is a frame, and no frame exists for 'everyone who uses this product'. Pew Research Center's American Trends Panel shows the alternative: a drawn sample with published methodology. That does not make it a census.
What do I put in a report when someone asks for the number?
Say what is measurable, name the body or document that would publish the rest, and state the decision the number was meant to inform. In practice the decision usually does not need the number. The discipline for reading a claim about a system is the same one, applied to somebody else's page.